Churn & Retention Analytics
SaaS Churn Early-Warning System
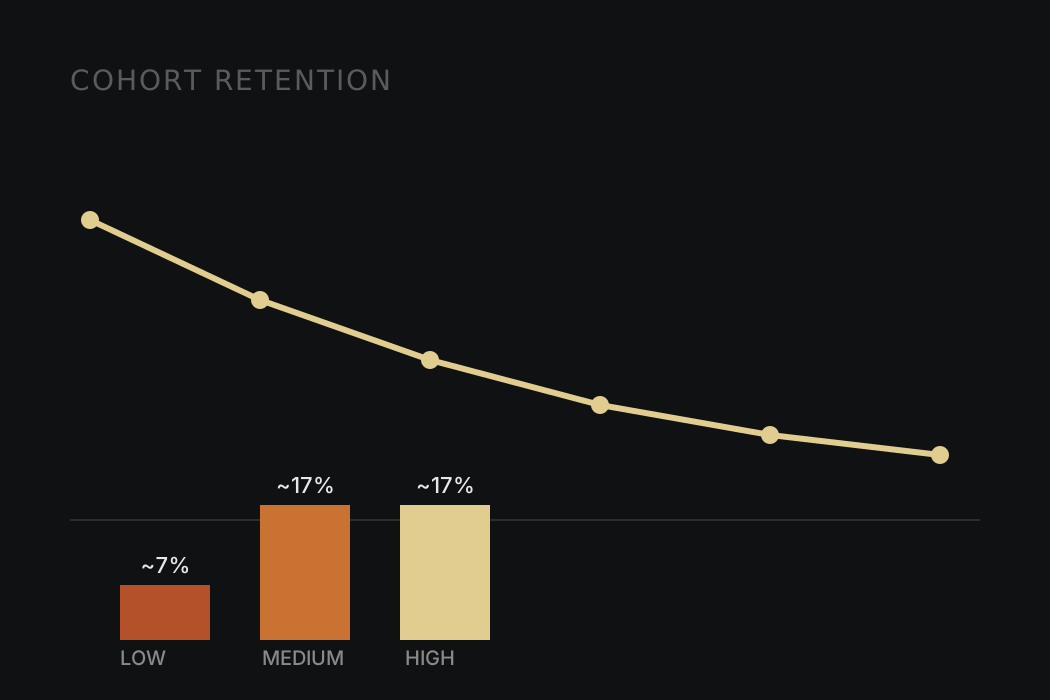
Aarya Bhivsanee built an early-warning system for SaaS customer churn using PostgreSQL and Tableau. HIGH and MEDIUM-risk accounts churned at about 17% a month versus 7% for LOW across 24 months, and retention fell from 90.1% at month 1 to 57.4% at month 6.
Overview
RavenStack, a synthetic SaaS company, needed to know not just that churn was happening, but where it was concentrated and whether a simple, explainable warning system could actually catch it before the fact.
Approach
Working in PostgreSQL, I built cohort retention tracking (M1/M3/M6) to find where the drop-off actually starts, quantified churned MRR by segment to find where the dollars were leaking from, and validated a rules-based risk-banding system — HIGH/MEDIUM/LOW — against real churn outcomes rather than just theorizing about which signals should matter.
Results
- Flagged who was about to leave: HIGH and MEDIUM-risk accounts churned at about 17% a month versus 7% for LOW across 24 months, using a rule-based score with reason codes (usage drop, errors, low CSAT, slow resolution).
- Showed where customers are lost: retention fell from 90.1% at month 1 to 57.4% at month 6 in PostgreSQL cohort curves, making onboarding the highest-leverage window.
- Caught churn getting worse: monthly logo churn rose from about 6% (May to Jul 2024) to 8 to 11% (Aug to Dec), lifting churned MRR to $400K to $500K a month, with 1–5 seat accounts losing about 18% of MRR a month.
The risk bands held up under validation: HIGH and MEDIUM-risk accounts churned at about 17% a month versus 7% for LOW across 24 months, with the score explained by reason codes (usage drop, errors, low CSAT, slow resolution). The whole thing was packaged into executive-facing Tableau dashboards, so the answer to "who's at risk and why" didn't require a SQL query every time someone asked.
Tools
- PostgreSQL
- Tableau
- Cohort retention analysis
- Rule-based risk scoring