Finding the moment things broke — and the why behind it. The data way.
Scroll DownHi, I'm Aarya Bhivsanee.
I'm a Data Science graduate and current Product & Data Analytics Intern at involveMINT, focused on why users stay, why they leave, and what happens in between. Most of my work lives in customer retention and behavior analysis: spotting accounts likely to churn, and mapping exactly where users drop off in a product. I gravitate toward e-commerce and subscription data, and love to find the one thing that actually explains the shift.
Right now I'm looking for roles in Data Analytics, Business Intelligence, or Product Analytics.
ResumeMRR Analyzed
$9.9M in paid MRR analyzed against an 8.02% weighted churn rate across 500 SaaS accounts.
At-Risk Churn Rate
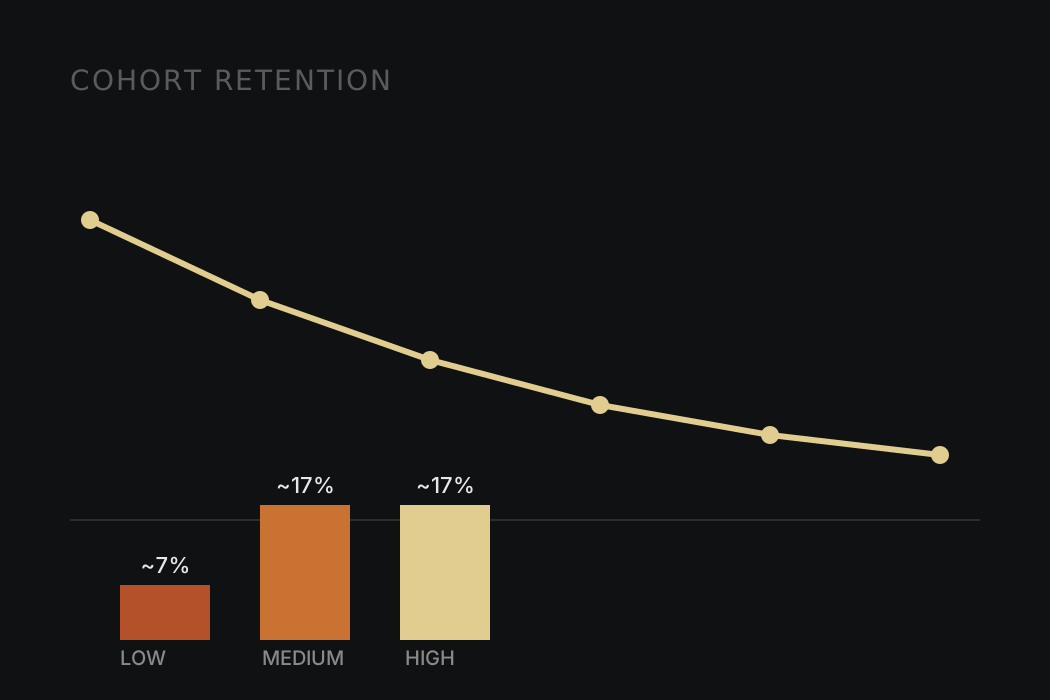
HIGH and MEDIUM-risk accounts churned at about 17% a month, versus 7% for LOW, across 24 months.
Sessions Analyzed
Diagnosed revenue leakage across a 1.76M-session funnel, down to the exact stage where it broke.
Conversion Lift
Returning visitors convert at about 3x the rate of new visitors, from 3 to 9 pm.
Skills & Tools
What's actually in the toolkit.
Analytics
Cohort & retention analysis, funnel analysis, and recurring revenue analysis (MRR, churn rate), plus KPI and metrics design.
Product Analytics
User journey mapping, friction analysis, product metrics, event tracking plans, A/B testing, and QA testing to find where users drop off and prioritize UI/UX fixes.
Statistics & Modeling
Statistical analysis, probability, anomaly detection, churn risk scoring, customer segmentation, root-cause and driver attribution, and data cleaning with feature engineering.
SQL
Snowflake, PostgreSQL, and MySQL — joins, CTEs, window functions, subqueries, aggregations, data modeling, and sessionization to query and shape data at scale.
Python
Pandas, NumPy, Matplotlib, Seaborn, Scikit-learn, SciPy, and BeautifulSoup for analysis and modeling.
Reporting & BI
Tableau and Power BI dashboard design, plus Microsoft Excel (pivot tables, VLOOKUP) and Google Sheets for stakeholder-ready reporting.
Data Tools
dbt, Jupyter Notebook, and Git/GitHub for reproducible analysis, plus Microsoft PowerPoint for clear communication.
AI-Assisted Workflows
Claude, Claude API, ChatGPT, Gemini, and n8n to speed up EDA, automate write-ups, and prototype analysis pipelines.
Selected Work
A few projects where the data caught something worth catching. Take a look.
SaaS Churn Early-Warning System
- Flagged who was about to leave: HIGH and MEDIUM-risk accounts churned at about 17% a month versus 7% for LOW across 24 months, using a rule-based score with reason codes (usage drop, errors, low CSAT, slow resolution).
- Showed where customers are lost: retention fell from 90.1% at month 1 to 57.4% at month 6 in PostgreSQL cohort curves, making onboarding the highest-leverage window.
- Caught churn getting worse: monthly logo churn rose from about 6% (May to Jul 2024) to 8 to 11% (Aug to Dec), lifting churned MRR to $400K to $500K a month, with 1–5 seat accounts losing about 18% of MRR a month.
SaaS Churn Early-Warning System
RavenStack, a synthetic SaaS company, needed to know not just that churn was happening, but where it was concentrated and whether a simple, explainable warning system could actually catch it before the fact.
Working in PostgreSQL, I built cohort retention tracking (M1/M3/M6) to find where the drop-off actually starts, quantified churned MRR by segment to find where the dollars were leaking from, and validated a rules-based risk-banding system — HIGH/MEDIUM/LOW — against real churn outcomes rather than just theorizing about which signals should matter.
The risk bands held up under validation: HIGH and MEDIUM-risk accounts churned at about 17% a month versus 7% for LOW across 24 months, with the score explained by reason codes (usage drop, errors, low CSAT, slow resolution). The whole thing was packaged into executive-facing Tableau dashboards, so the answer to "who's at risk and why" didn't require a SQL query every time someone asked.

E-Commerce Funnel Diagnostics
- Located the real leak: 97.8% of viewing sessions never reach cart, while 72.8% cart abandonment sits near the roughly 70% industry average, so the fix is the product page and add-to-cart step, not a checkout redesign.
- Found returning visitors converting at about 3x new visitors from 3 to 9 pm and several high-traffic categories below average, shaping 3 proposed A/B tests (product page, category UX, cart recovery).
- Built a PostgreSQL session mart (1,761,675 sessions; 30-minute sessionization, window functions) feeding 4 Tableau dashboards on funnel health, segmentation, category performance and time to convert, because aggregate metrics alone would have hidden the leak.
E-Commerce Funnel Diagnostics
The instinct going in was that checkout would be the leak — it usually is. Working from the RetailRocket eCommerce events dataset (views, add-to-cart, transactions), I built a session-level clickstream mart in PostgreSQL from scratch: sessionization, timestamp cleaning, and stage-by-stage conversion tracking across the full funnel.
The data told a different story. 97.8% of viewing sessions never reached cart, while 72.8% cart abandonment sat near the roughly 70% industry average. Aggregate, top-line metrics would have hidden this entirely; only session-level tracking surfaced exactly where the funnel actually breaks.
That reframed the fix: not a checkout redesign, but product-page clarity. I also found returning visitors converting at about 3x the rate of new visitors from 3 to 9 pm, pointing at the first-visit experience as much as the funnel itself. The output was 3 proposed A/B tests (PDP clarity, category UX, cart recovery) and 4 Tableau dashboards, packaged into a stakeholder memo — not just a chart, a specific, arguable recommendation.
GMV Anomaly Detection Pipeline
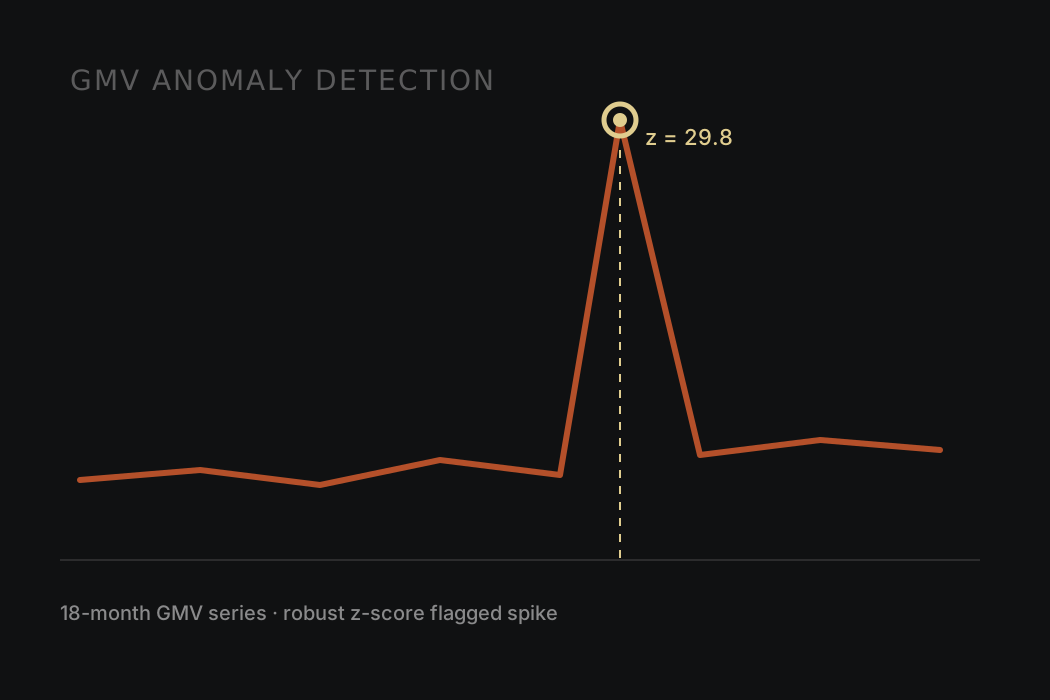
- Built an anomaly detector on MAD-based robust z-scores (less fooled by volatility than a standard-deviation threshold) over detrended GMV residuals, surfacing 12 revenue anomalies across 18 months with severity tiers, and validated it by catching all 3 synthetic shocks.
- Flagged Black Friday as a +558% spike (z=29.79) and attributed it to its drivers: 72% of the delta came from Southeast Brazil, so the spike was regional, not random.
- Automated the explanations: an LLM limited to precomputed fact packets writes What/Why/Action briefs where every number traces back to the data.
GMV Anomaly Detection Pipeline
Revenue swings are normal in GMV data — the hard part is telling a real anomaly apart from ordinary volatility fast enough for it to matter. Standard deviation-based thresholds kept getting fooled by that volatility, throwing false alarms or missing the real ones.
I switched to MAD-based robust z-scores on detrended residuals, which held up cleanly against 3 synthetic stress-test shocks where the standard-deviation approach didn't. The pipeline runs in Python against a PostgreSQL revenue store, decomposing trend from noise before scoring, then tagging each flagged event with a severity level and a driver attribution — which region, which segment, how much of the delta it explains.
The last piece was making the output usable without a follow-up meeting: I constrained an LLM to only the pre-computed fact packets (no open-ended querying), so every generated brief is auditable back to a specific number. Across 18 months, the pipeline surfaced 12 flagged events this way — including a Black Friday spike of +558% (z=29.79) correctly attributed to Southeast Brazil at 72% of the total delta, with every number traceable back to the data.
H-1B LCA Disclosure Analytics Pipeline
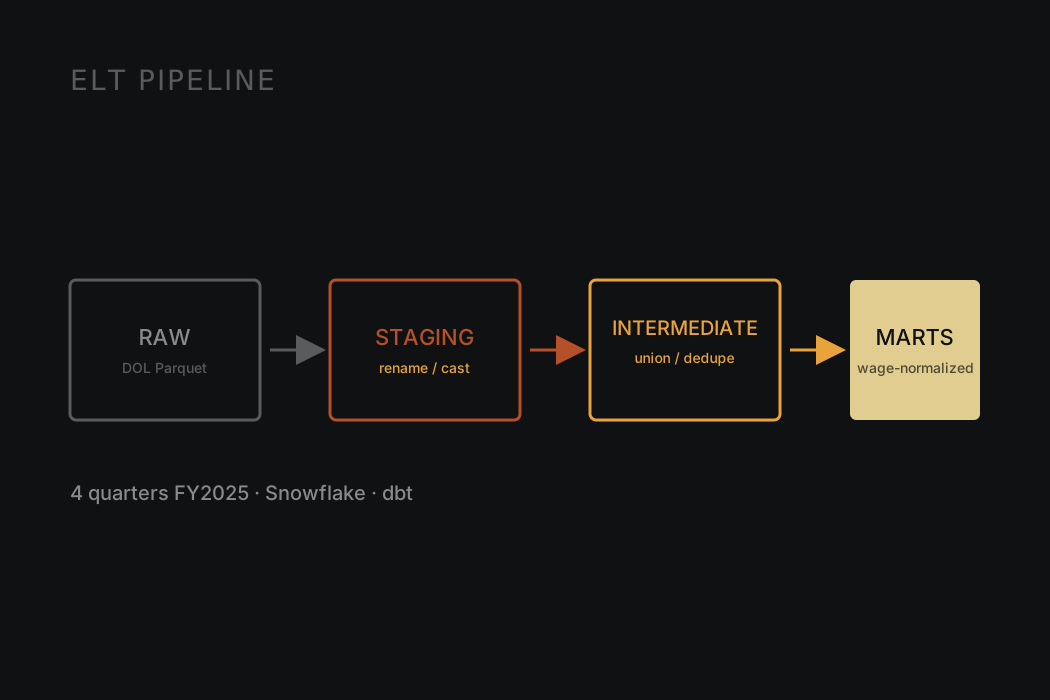
- Built an ELT pipeline from raw DOL Excel/Parquet files into Snowflake, layered through dbt as RAW → staging → intermediate → marts, so every transformation is visible in version control, not patched silently in the warehouse.
- Reconciled real source inconsistencies explicitly in staging: a hyphen-vs-underscore column rename between Q1 and Q2–Q4, and nanosecond Unix timestamps cast to real dates.
- Normalized wages mixing Hour/Week/Bi-Weekly/Month/Year units into one annualized figure, flagging implausible values instead of silently guessing or dropping them.
- Deduplicated four quarters of FY2025 LCA disclosures down to one row per case, tracking H-1B sponsorship by employer, industry, and role across the NY/NJ tech market.
H-1B LCA Disclosure Analytics Pipeline
This one started as a data engineering exercise and became a question worth answering: how is H-1B sponsorship actually distributed across employers, industries, and roles, especially in the NY/NJ tech market?
The pipeline moves DOL's quarterly LCA disclosure Excel/Parquet files into Snowflake, then through dbt in explicit layers — RAW (an untouched mirror of the source), staging (rename/cast only), intermediate (union all 4 quarters, dedupe to one row per case), and marts (wage-normalized, ready for BI). Every schema name signals exactly what's been touched, so nothing gets quietly patched in the warehouse.
The real work was in the edge cases the source data doesn't hand you cleanly: Q1's raw schema uses a hyphenated column name that Q2–Q4 don't, dates arrive as nanosecond Unix timestamps instead of real dates, and wages mix Hour/Week/Bi-Weekly/Month/Year units in the same column. I normalized all of it to an annualized figure in the marts layer — and where a value was implausible but plausibly just mislabeled, I flagged it in a separate column instead of silently correcting or dropping it. The goal throughout: every transformation decision stays visible and defensible, not buried.
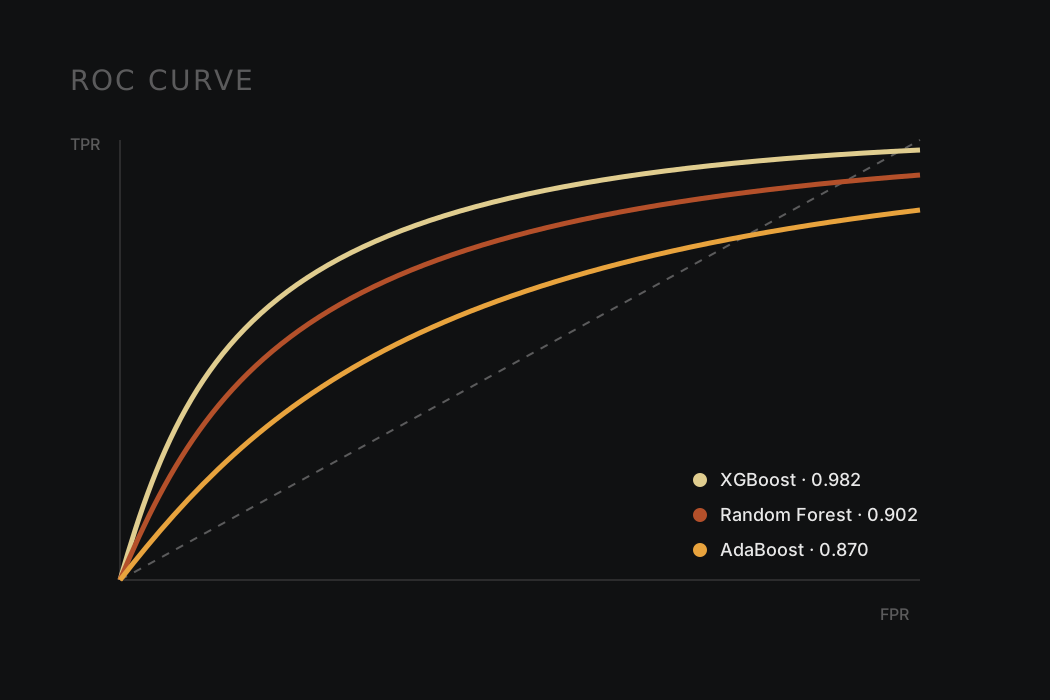
- Benchmarked three classifiers — Random Forest, AdaBoost, and XGBoost — on highly imbalanced transaction data, evaluated by ROC-AUC rather than raw accuracy.
- XGBoost led at 0.982 ROC-AUC, outperforming Random Forest (0.902) and AdaBoost (0.870) at catching fraudulent transactions.
- Explored anonymized, PCA-transformed transaction features to find what separates fraud from legitimate activity without access to raw transaction meaning.
- Built interactive Plotly visualizations to make model results and class-imbalance tradeoffs inspectable, not just a single accuracy number.
Credit Card Fraud Detection
Fraud detection is a textbook imbalanced-classification problem — the interesting cases are a tiny fraction of the data, which makes accuracy a useless metric; a model that never flags fraud is still "99.8% accurate."
Working from the anonymized, PCA-transformed Kaggle credit card transaction dataset, I benchmarked three classifiers — Random Forest, AdaBoost, and XGBoost — scored by ROC-AUC instead. XGBoost led clearly at 0.982, ahead of Random Forest (0.902) and AdaBoost (0.870).
Because the features are PCA components rather than raw transaction fields, there's no way to reason about them from domain knowledge alone — the exploratory analysis had to lean entirely on the data's statistical structure to find what actually separated fraud from legitimate activity. I built interactive Plotly visualizations around the results so the class-imbalance tradeoffs and model comparisons were something a reader could actually inspect, not just a single accuracy number to take on faith.
Background
Experience and Education
Experience
Product & Data Analytics Intern
- Defining the retention measurement framework (activation, active, retained, churned) for a two-sided credit exchange and mapping the 5 priority member journeys (onboarding, invites, send credit, ordering) to find drop-off before a first trade.
- Designing an event tracking plan to capture the abandoned attempts the database misses, tagging each drop-off as UX friction or market (supply) friction, with a ranked friction audit to prioritize UI/UX fixes alongside A/B test data.
- Building Python visualizations and reports on transaction, credit balance, treasury wallet and retention data while migrating the member dashboard to the new platform, QA testing features and supporting product scoping and documentation.
Graduate Peer Leader
- Sat down individually with incoming graduate students who were navigating a new program, sometimes a new country, and helped turn a list of worries into an actual plan for coursework, timelines, and where to go for help.
- Built repeatable structure around something that's usually left informal, goal-setting conversations that actually produced next steps, not just reassurance.
- The instinct underneath it is the same one behind the data work: someone hands you something unclear and a little overwhelming, and the job is to make it concrete enough to move on.
Data Science Intern
- Cleaned and engineered features across a 768-patient, 8-variable clinical dataset (glucose, BMI, insulin), preparing the data for predictor and risk analysis.
- Identified glucose, BMI, and age as the strongest predictors of diabetes risk through variable contribution analysis, not the variables that looked interesting on the surface, and translated the findings into stakeholder-ready visualizations of risk-factor and segment-level patterns.
Education
M.S. in Data Science
Relevant coursework: Web Mining, Marketing Analytics, Statistical Methods, Applied Machine Learning.
B.E. in Artificial Intelligence & Data Science
Get In Touch
Have a data problem worth digging into? Let's talk.
I'm currently looking for opportunities in data analytics, business intelligence, and product analytics. Reach out if you'd like to see the work behind these numbers, or talk about a role.
Prefer to read it online? See the resume page, the project case studies or the About page.