Anomaly Detection · Python
GMV Anomaly Detection Pipeline
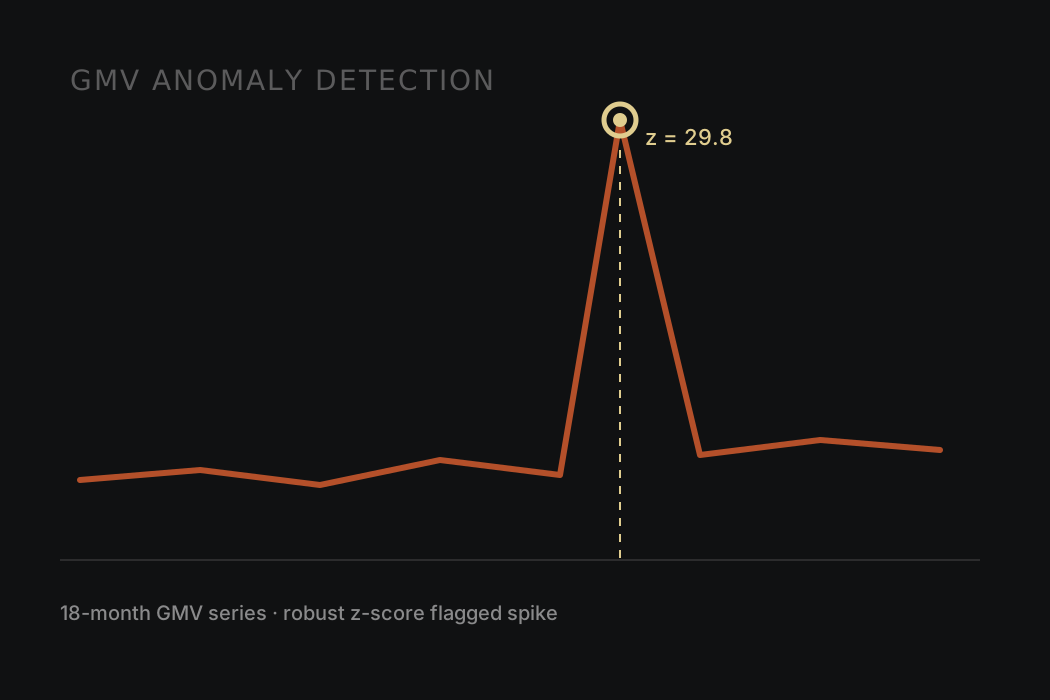
Aarya Bhivsanee built a revenue anomaly detector on MAD-based robust z-scores that surfaced 12 anomalies across 18 months and caught all 3 synthetic shocks. It flagged Black Friday as a +558% spike (z=29.79) and attributed 72% of that change to Southeast Brazil.
Overview
Revenue swings are normal in GMV data — the hard part is telling a real anomaly apart from ordinary volatility fast enough for it to matter. Standard deviation-based thresholds kept getting fooled by that volatility, throwing false alarms or missing the real ones.
Approach
I switched to MAD-based robust z-scores on detrended residuals, which held up cleanly against 3 synthetic stress-test shocks where the standard-deviation approach didn't. The pipeline runs in Python against a PostgreSQL revenue store, decomposing trend from noise before scoring, then tagging each flagged event with a severity level and a driver attribution — which region, which segment, how much of the delta it explains.
Results
- Built an anomaly detector on MAD-based robust z-scores (less fooled by volatility than a standard-deviation threshold) over detrended GMV residuals, surfacing 12 revenue anomalies across 18 months with severity tiers, and validated it by catching all 3 synthetic shocks.
- Flagged Black Friday as a +558% spike (z=29.79) and attributed it to its drivers: 72% of the delta came from Southeast Brazil, so the spike was regional, not random.
- Automated the explanations: an LLM limited to precomputed fact packets writes What/Why/Action briefs where every number traces back to the data.
The last piece was making the output usable without a follow-up meeting: I constrained an LLM to only the pre-computed fact packets (no open-ended querying), so every generated brief is auditable back to a specific number. Across 18 months, the pipeline surfaced 12 flagged events this way — including a Black Friday spike of +558% (z=29.79) correctly attributed to Southeast Brazil at 72% of the total delta, with every number traceable back to the data.
Tools
- PostgreSQL
- Python
- Claude API
- Tableau